
Groups of features
Contents of this tutorial: - Build a model - Contruct groups of features - Compile Shapash SmartExplainer with the groups - Start Shapash WebApp - Explore the functions of Shapash using groups - Use groups of features in production with SmartPredictor object
Data from Kaggle House Prices
Motivation
In this use case, we have a lot of features that describe the house very precisely.
Also, you may want to understand why your model predicted such an important price for a specific house. If many features describing the location of the house are contributing slightly more than usual to a higher price, it may not be visible directly that the price is due to the location because of the number of features. But grouping these variables together allows to easily understand a specific prediction. Shapash also allows you to group features together in local plots.
[1]:
import pandas as pd
from category_encoders import OrdinalEncoder
from lightgbm import LGBMRegressor
from sklearn.model_selection import train_test_split
Building a supervized model
Load House Prices data
[2]:
from shapash.data.data_loader import data_loading
house_df, house_dict = data_loading('house_prices')
[3]:
house_df.head()
[3]:
| MSSubClass | MSZoning | LotArea | Street | LotShape | LandContour | Utilities | LotConfig | LandSlope | Neighborhood | ... | EnclosedPorch | 3SsnPorch | ScreenPorch | PoolArea | MiscVal | MoSold | YrSold | SaleType | SaleCondition | SalePrice | |
|---|---|---|---|---|---|---|---|---|---|---|---|---|---|---|---|---|---|---|---|---|---|
| Id | |||||||||||||||||||||
| 1 | 2-Story 1946 & Newer | Residential Low Density | 8450 | Paved | Regular | Near Flat/Level | All public Utilities (E,G,W,& S) | Inside lot | Gentle slope | College Creek | ... | 0 | 0 | 0 | 0 | 0 | 2 | 2008 | Warranty Deed - Conventional | Normal Sale | 208500 |
| 2 | 1-Story 1946 & Newer All Styles | Residential Low Density | 9600 | Paved | Regular | Near Flat/Level | All public Utilities (E,G,W,& S) | Frontage on 2 sides of property | Gentle slope | Veenker | ... | 0 | 0 | 0 | 0 | 0 | 5 | 2007 | Warranty Deed - Conventional | Normal Sale | 181500 |
| 3 | 2-Story 1946 & Newer | Residential Low Density | 11250 | Paved | Slightly irregular | Near Flat/Level | All public Utilities (E,G,W,& S) | Inside lot | Gentle slope | College Creek | ... | 0 | 0 | 0 | 0 | 0 | 9 | 2008 | Warranty Deed - Conventional | Normal Sale | 223500 |
| 4 | 2-Story 1945 & Older | Residential Low Density | 9550 | Paved | Slightly irregular | Near Flat/Level | All public Utilities (E,G,W,& S) | Corner lot | Gentle slope | Crawford | ... | 272 | 0 | 0 | 0 | 0 | 2 | 2006 | Warranty Deed - Conventional | Abnormal Sale | 140000 |
| 5 | 2-Story 1946 & Newer | Residential Low Density | 14260 | Paved | Slightly irregular | Near Flat/Level | All public Utilities (E,G,W,& S) | Frontage on 2 sides of property | Gentle slope | Northridge | ... | 0 | 0 | 0 | 0 | 0 | 12 | 2008 | Warranty Deed - Conventional | Normal Sale | 250000 |
5 rows × 73 columns
[4]:
y = house_df['SalePrice']
X = house_df.drop('SalePrice', axis=1)
Encoding Categorical Features
[5]:
categorical_features = [col for col in X.columns if X[col].dtype == 'object']

encoder = OrdinalEncoder(
    cols=categorical_features,
    handle_unknown='ignore',
    return_df=True
).fit(X)

X = encoder.transform(X)
Train / Test Split
[6]:
X_train, X_test, y_train, y_test = train_test_split(X, y, train_size=0.75, random_state=1)
Model fitting
[7]:
regressor = LGBMRegressor(n_estimators=200).fit(X_train, y_train)
[LightGBM] [Info] Auto-choosing col-wise multi-threading, the overhead of testing was 0.001653 seconds.
You can set `force_col_wise=true` to remove the overhead.
[LightGBM] [Info] Total Bins 2986
[LightGBM] [Info] Number of data points in the train set: 1095, number of used features: 66
[LightGBM] [Info] Start training from score 182319.757078
Construct groups of features
There are quite a lot of features used by the model and it can be hard to compare them.
We can regroup the features that share similarities in order to identify which topic is important.
In our example we constructed the following new groups : - location: features related to the location of the house - size: features that measure part of the house - aspect: features that evaluate the style of any part of the house - condition: features related to the quality of anything in the house - configuration: features about the general configuration / shape of the house - equipment: features that describe the equipment of the house (electricity, gas, heating…) -
garage: features related to the garage (style, …) - sale: features related to the sale of the house
[8]:
# We construct the groups as a dictionary of string keys and list of string values
# All the features inside the list will belong to the same group
features_groups = {
    "location": ["MSZoning", "Neighborhood", "Condition1", "Condition2"],
    "size": [
        "LotArea",
        "MasVnrArea",
        "BsmtQual",
        "BsmtFinSF2",
        "BsmtUnfSF",
        "TotalBsmtSF",
        "1stFlrSF",
        "2ndFlrSF",
        "GrLivArea",
        "WoodDeckSF",
        "OpenPorchSF",
        "EnclosedPorch",
        "3SsnPorch",
        "ScreenPorch",
        "PoolArea",
        "BsmtFinSF1"
    ],
    "aspect": [
        "LotShape",
        "LandContour",
        "RoofStyle",
        "RoofMatl",
        "Exterior1st",
        "MasVnrType",
    ],
    "condition": [
        "OverallQual",
        "OverallCond",
        "ExterQual",
        "ExterCond",
        "BsmtCond",
        "BsmtFinType1",
        "BsmtFinType2",
        "HeatingQC",
        "KitchenQual"
    ],
    "configuration": ["LotConfig", "LandSlope", "BldgType", "HouseStyle"],
    "equipment": ["Heating", "CentralAir", "Electrical"],
    "garage": [
        "GarageType",
        "GarageYrBlt",
        "GarageFinish",
        "GarageArea",
        "GarageQual",
        "GarageCond",
    ],
    "sale": ["SaleType", "SaleCondition", "MoSold", "YrSold"]
}
Optional : we can also give labels to groups names
[9]:
groups_labels = {
    'location': 'Location of the property',
    'size' : 'Size of different elements in the house',
    'aspect': 'Aspect of the house',
    'condition': 'Quality of the materials and parts of the property',
    'configuration': 'Configuration of the house',
    'equipment': 'All equipments',
    'garage': 'Garage group of features',
    'sale': 'Sale information'
}
house_dict.update(groups_labels)
Compile Shapash SmartExplainer object using groups
[10]:
from shapash import SmartExplainer
# optional parameter, specifies label for features and groups name
xpl = SmartExplainer(
    model=regressor,
    preprocessing=encoder,
    features_groups=features_groups,
    features_dict=house_dict
)
[11]:
xpl.compile(x=X_test,
    y_target=y_test, # Optional: allows to display True Values vs Predicted Values
    )
INFO: Shap explainer type - <shap.explainers._tree.TreeExplainer object at 0x7fcf441b0370>
Start WebApp
We can now start the webapp using the following cell.
groups switch button.Also you can click on a group’s bar to display the features importance of the features inside the group.
[ ]:
app = xpl.run_app(title_story='House Prices')
Stop the WebApp after using it
[ ]:
app.kill()
Explore the functions of Shapash using groups
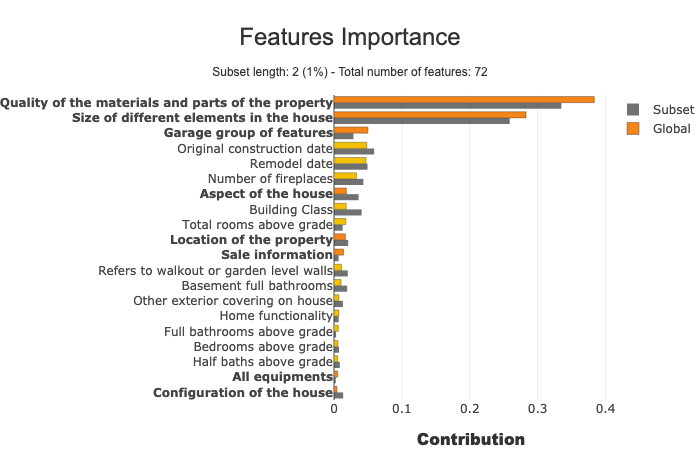
Features importance plot
Display the features importance plot that includes the groups and excludes the features inside each group
[14]:
xpl.plot.features_importance(selection=[259, 268])
[14]:
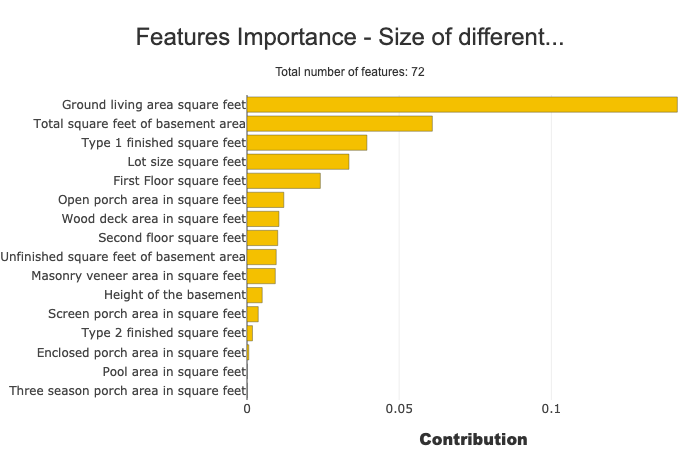
Display the features importance plot of the features inside one group
[15]:
xpl.plot.features_importance(group_name='size')
[15]:
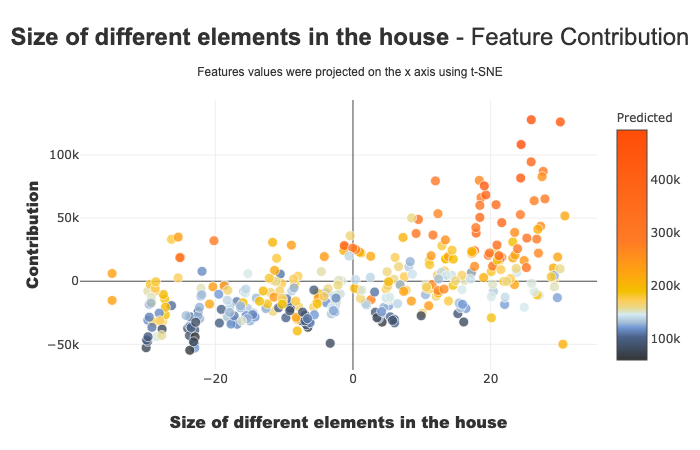
Contribution plot
[16]:
xpl.plot.contribution_plot('size')
[16]:
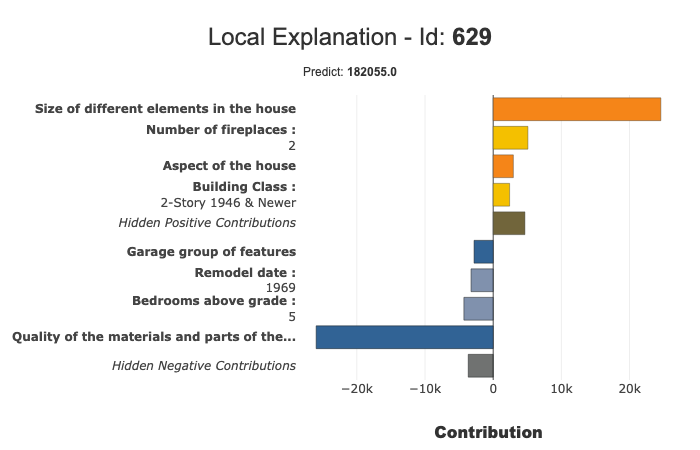
Local plot
By default, Shapash will display the groups in the local plot.
You can directly see the impact of the different groups of features for the given observation.
[17]:
xpl.filter(max_contrib=8)
[18]:
xpl.plot.local_plot(index=629)
[18]:
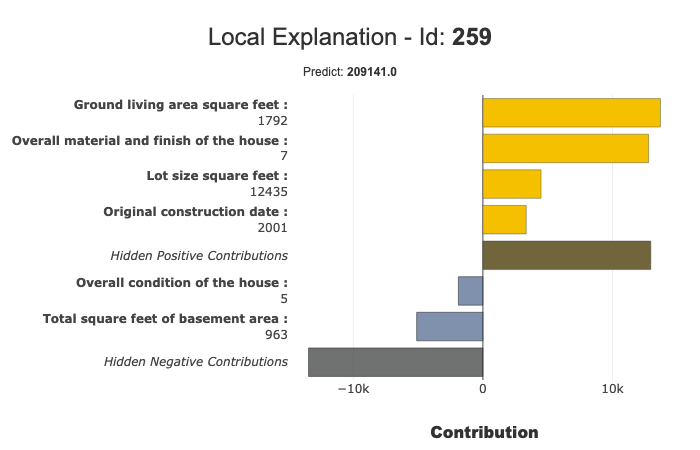
You can also display the features without the groups using the following parameters :
[19]:
xpl.filter(max_contrib=6, display_groups=False)
[20]:
xpl.plot.local_plot(index=259, display_groups=False)
[20]:
Use groups of features in production with SmartPredictor object
[21]:
predictor = xpl.to_smartpredictor()
Create an imput and use add_input method of SmartPredictor object
[22]:
sample_input = house_df.sample(4).drop('SalePrice', axis=1)
sample_input
[22]:
| MSSubClass | MSZoning | LotArea | Street | LotShape | LandContour | Utilities | LotConfig | LandSlope | Neighborhood | ... | OpenPorchSF | EnclosedPorch | 3SsnPorch | ScreenPorch | PoolArea | MiscVal | MoSold | YrSold | SaleType | SaleCondition | |
|---|---|---|---|---|---|---|---|---|---|---|---|---|---|---|---|---|---|---|---|---|---|
| Id | |||||||||||||||||||||
| 436 | 2-Story 1946 & Newer | Residential Low Density | 10667 | Paved | Moderately Irregular | Near Flat/Level | All public Utilities (E,G,W,& S) | Cul-de-sac | Gentle slope | College Creek | ... | 61 | 0 | 0 | 0 | 0 | 0 | 4 | 2009 | Contract Low Down payment and low interest | Normal Sale |
| 901 | 1-Story 1946 & Newer All Styles | Residential Low Density | 7340 | Paved | Slightly irregular | Near Flat/Level | All public Utilities (E,G,W,& S) | Inside lot | Gentle slope | North Ames | ... | 0 | 0 | 0 | 0 | 0 | 0 | 6 | 2007 | Warranty Deed - Conventional | Normal Sale |
| 1355 | 2-Story 1946 & Newer | Residential Low Density | 10316 | Paved | Slightly irregular | Near Flat/Level | All public Utilities (E,G,W,& S) | Inside lot | Gentle slope | College Creek | ... | 184 | 0 | 0 | 0 | 0 | 0 | 6 | 2008 | Warranty Deed - Conventional | Normal Sale |
| 244 | 2-Story PUD-1946 & Newer | Residential Low Density | 10762 | Paved | Regular | Near Flat/Level | All public Utilities (E,G,W,& S) | Corner lot | Gentle slope | Sawyer West | ... | 28 | 0 | 0 | 0 | 0 | 0 | 4 | 2009 | Warranty Deed - Conventional | Normal Sale |
4 rows × 72 columns
[23]:
predictor.add_input(sample_input)
INFO: Shap explainer type - <shap.explainers._tree.TreeExplainer object at 0x7fcf441b0370>
/home/79461r/.conda/envs/keltarif_39/lib/python3.9/site-packages/category_encoders/ordinal.py:198: FutureWarning:

Downcasting object dtype arrays on .fillna, .ffill, .bfill is deprecated and will change in a future version. Call result.infer_objects(copy=False) instead. To opt-in to the future behavior, set `pd.set_option('future.no_silent_downcasting', True)`
use_groups parameter[24]:
predictor.detail_contributions()
INFO: Shap explainer type - <shap.explainers._tree.TreeExplainer object at 0x7fcf441b0370>
[24]:
| ypred | MSSubClass | Street | Utilities | YearBuilt | YearRemodAdd | Exterior2nd | Foundation | BsmtExposure | LowQualFinSF | ... | PavedDrive | MiscVal | location | size | aspect | condition | configuration | equipment | garage | sale | |
|---|---|---|---|---|---|---|---|---|---|---|---|---|---|---|---|---|---|---|---|---|---|
| Id | |||||||||||||||||||||
| 436 | 204823.181059 | 2065.214959 | 0.0 | 0.0 | 2967.425942 | 1629.004923 | 579.479561 | 1239.153752 | 1213.533844 | 0.0 | ... | 43.823258 | -2.583300 | -657.282753 | -7769.288367 | 2521.394322 | 12166.952238 | 2009.857231 | 13.213734 | 2170.635423 | -1020.101898 |
| 901 | 118236.106783 | 656.087505 | 0.0 | 0.0 | -132.488062 | -1755.079708 | -218.324403 | -611.490088 | -450.037449 | 0.0 | ... | 72.398246 | -1.615371 | -184.701377 | -31556.344341 | -215.744630 | -31014.502704 | -245.515921 | 410.619126 | 3793.634968 | 886.022752 |
| 1355 | 235004.669339 | 2998.973867 | 0.0 | 0.0 | 2729.870508 | 1982.290245 | 659.715052 | 736.225878 | -772.037812 | 0.0 | ... | 35.369545 | -2.293088 | 1037.882932 | 11574.270636 | 270.462779 | 12375.807920 | 19.729604 | 24.995704 | 16054.071349 | 83.051360 |
| 244 | 122412.294643 | -1694.327005 | 0.0 | 0.0 | 179.740672 | -2287.430112 | -337.729828 | -171.935819 | -718.701115 | 0.0 | ... | 45.044229 | -2.693414 | -523.380963 | -29962.163070 | 720.138010 | -18221.657298 | -307.088907 | 164.191467 | -7443.766684 | -862.593173 |
4 rows × 29 columns
[25]:
# Replace groups of features we created with their corresponding features contributions
predictor.detail_contributions(use_groups=False)
INFO: Shap explainer type - <shap.explainers._tree.TreeExplainer object at 0x7fcf441b0370>
[25]:
| ypred | MSSubClass | MSZoning | LotArea | Street | LotShape | LandContour | Utilities | LotConfig | LandSlope | ... | OpenPorchSF | EnclosedPorch | 3SsnPorch | ScreenPorch | PoolArea | MiscVal | MoSold | YrSold | SaleType | SaleCondition | |
|---|---|---|---|---|---|---|---|---|---|---|---|---|---|---|---|---|---|---|---|---|---|
| Id | |||||||||||||||||||||
| 436 | 204823.181059 | 2065.214959 | 439.980549 | 1122.624757 | 0.0 | 2552.768486 | 28.023946 | 0.0 | 1843.333050 | -8.438472 | ... | 1180.499098 | 45.200121 | 0.0 | -275.513539 | 0.0 | -2.583300 | -234.466291 | -946.579780 | 85.185242 | 75.758931 |
| 901 | 118236.106783 | 656.087505 | 304.793800 | -1235.148056 | 0.0 | 371.868060 | 188.844755 | 0.0 | -82.070475 | -13.076696 | ... | -446.884475 | -29.199097 | 0.0 | -183.907781 | 0.0 | -1.615371 | 637.739506 | 193.961044 | -105.063845 | 159.386047 |
| 1355 | 235004.669339 | 2998.973867 | 230.518310 | 272.025317 | 0.0 | 111.483129 | 38.928399 | 0.0 | -281.796337 | -31.775538 | ... | 3254.710492 | 67.086326 | 0.0 | -352.065611 | 0.0 | -2.293088 | 233.357277 | -70.085844 | -164.508467 | 84.288395 |
| 244 | 122412.294643 | -1694.327005 | 800.561360 | 977.557371 | 0.0 | -1066.173916 | 56.128030 | 0.0 | -201.989625 | -36.830631 | ... | -383.480612 | -74.102357 | 0.0 | -200.089675 | 0.0 | -2.693414 | -906.830783 | -378.732127 | -169.873709 | 592.843446 |
4 rows × 73 columns
modify_mask method :[26]:
predictor.modify_mask(max_contrib=4)
The summarize method will contain the groups of features contributions and the value_x columns will contain all the values of the features of the corresponding group as a dict.
[27]:
predictor.summarize()
[27]:
| ypred | feature_1 | value_1 | contribution_1 | feature_2 | value_2 | contribution_2 | feature_3 | value_3 | contribution_3 | feature_4 | value_4 | contribution_4 | |
|---|---|---|---|---|---|---|---|---|---|---|---|---|---|
| 436 | 204823.181059 | Quality of the materials and parts of the prop... | {'Overall material and finish of the house': 7... | 12166.952238 | Size of different elements in the house | {'Lot size square feet': 10667.0, 'Masonry ven... | -7769.288367 | Original construction date | 1996 | 2967.425942 | Aspect of the house | {'General shape of property': 3, 'Flatness of ... | 2521.394322 |
| 901 | 118236.106783 | Size of different elements in the house | {'Lot size square feet': 7340.0, 'Masonry vene... | -31556.344341 | Quality of the materials and parts of the prop... | {'Overall material and finish of the house': 4... | -31014.502704 | Garage group of features | {'Garage location': 2.0, 'Year garage was buil... | 3793.634968 | Number of fireplaces | 0 | -1978.674665 |
| 1355 | 235004.669339 | Garage group of features | {'Garage location': 1.0, 'Year garage was buil... | 16054.071349 | Quality of the materials and parts of the prop... | {'Overall material and finish of the house': 7... | 12375.80792 | Size of different elements in the house | {'Lot size square feet': 10316.0, 'Masonry ven... | 11574.270636 | Building Class | 2-Story 1946 & Newer | 2998.973867 |
| 244 | 122412.294643 | Size of different elements in the house | {'Lot size square feet': 10762.0, 'Masonry ven... | -29962.16307 | Quality of the materials and parts of the prop... | {'Overall material and finish of the house': 6... | -18221.657298 | Garage group of features | {'Garage location': 1.0, 'Year garage was buil... | -7443.766684 | Remodel date | 1980 | -2287.430112 |
[28]:
# Removes the groups of features in the summary and replace them with their corresponding features
predictor.summarize(use_groups=False)
[28]:
| ypred | feature_1 | value_1 | contribution_1 | feature_2 | value_2 | contribution_2 | feature_3 | value_3 | contribution_3 | feature_4 | value_4 | contribution_4 | |
|---|---|---|---|---|---|---|---|---|---|---|---|---|---|
| 436 | 204823.181059 | Overall material and finish of the house | 7 | 8208.262746 | Total square feet of basement area | 799 | -6415.71848 | Original construction date | 1996 | 2967.425942 | General shape of property | Moderately Irregular | 2552.768486 |
| 901 | 118236.106783 | Overall material and finish of the house | 4 | -32815.241448 | Ground living area square feet | 858 | -20828.532247 | Total square feet of basement area | 858 | -5998.344197 | Size of garage in square feet | 684 | 4455.152029 |
| 1355 | 235004.669339 | Ground living area square feet | 1865 | 21066.734064 | Size of garage in square feet | 839 | 16226.244604 | Overall material and finish of the house | 7 | 11732.738552 | Total square feet of basement area | 992 | -6750.784976 |
| 244 | 122412.294643 | Overall material and finish of the house | 6 | -16853.107942 | Ground living area square feet | 1217 | -10930.60124 | Total square feet of basement area | 626 | -8098.740953 | Size of garage in square feet | 288 | -7579.75253 |